💼 Overview
This Power BI dashboard template is a ready-to-use financial analytics tool designed for tracking, analyzing, and presenting income and expenses across multiple companies. It is ideal for finance teams, consultants, business owners, or analysts looking to gain actionable insights from financial data in real time.
📊 Key Dashboard Features
✅ Top-Level KPIs
-
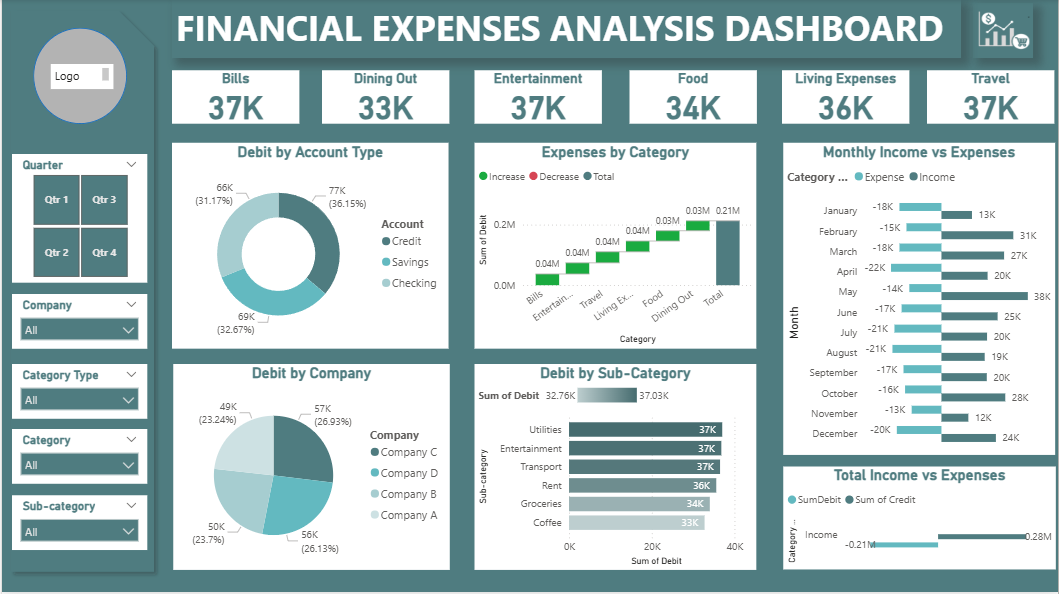
Visual Summary Tiles at the top display quick totals for major expense categories like:
-
Bills, Dining Out, Entertainment, Food, Living Expenses, Travel
-
-
These give an instant overview of high-spending areas.
🧾 Debit by Account Type (Donut Chart)
-
Shows how expenses are distributed across Credit, Savings, and Checking accounts.
-
Helps identify which accounts are most used for spending.
🏢 Debit by Company (Donut Chart)
-
Breaks down expenses by Company A, B, C, and D.
-
Useful for businesses managing multi-company finances or departments.
📈 Expenses by Category (Bar Chart with Waterfall Effect)
-
Highlights total and incremental changes in expenses for:
-
Bills, Entertainment, Travel, Living Expenses, Food, Dining Out.
-
-
Enables better budget management and spending control.
🧩 Debit by Sub-Category (Horizontal Bar Chart)
-
Granular view of sub-categories like:
-
Utilities, Entertainment, Transport, Rent, Groceries, Coffee.
-
-
Understands what exactly is driving your costs.
📅 Monthly Income vs Expenses
-
Compares income and expenses month-wise for all 12 months.
-
Easily identify surplus or deficit months.
🔄 Total Income vs Expenses (Summary Bar)
-
Overall comparison between total debit (expenses) and total credit (income).
-
Highlights whether you’re in profit or loss.
🧭 Interactive Filters (Slicers on the Left)
-
Users can filter data by:
-
Quarter (Q1–Q4)
-
Company
-
Category Type (Income / Expense)
-
Category (e.g., Food, Travel)
-
Sub-category (e.g., Rent, Coffee)
-
-
Makes this dashboard highly customizable and interactive.
💡 Who Can Use This?
-
Finance departments in SMEs and large companies
-
Freelance accountants and consultants
-
Small business owners managing multiple cost centers
-
Startups who need quick insights into spending patterns
📦 What’s Included?
-
Pre-built Power BI Dashboard (.pbix) and .pbit file
-
Sample financial expenses dataset (Excel/CSV)
-
Clean, professional layout with modern visual aesthetics
-
No coding required – just plug in your data and go!
🎯 Selling Points
-
100% dynamic and interactive
-
Dashboard-ready – just connect your dataset
-
Easy to extend to more companies, categories, or time periods
-
Highly visual, user-friendly, and business-ready

Reviews
There are no reviews yet.